
Risk is dynamic. As time goes by, a possible event may become more likely and its consequences more severe or less. It could go either way.
Risk owners need to identify the indicators of that change. These are your risk indicators. They indicate whether risk is changing and how it’s changing.
Control owners will need to monitor them so they can tell if they’re controlling the risk effectively.
Your risk practitioners can help risk owners to identify risk indicators. They can also help analyse the costs and benefits to see if monitoring the risk indicators is worth the effort, given the kinds of decisions you need to make.
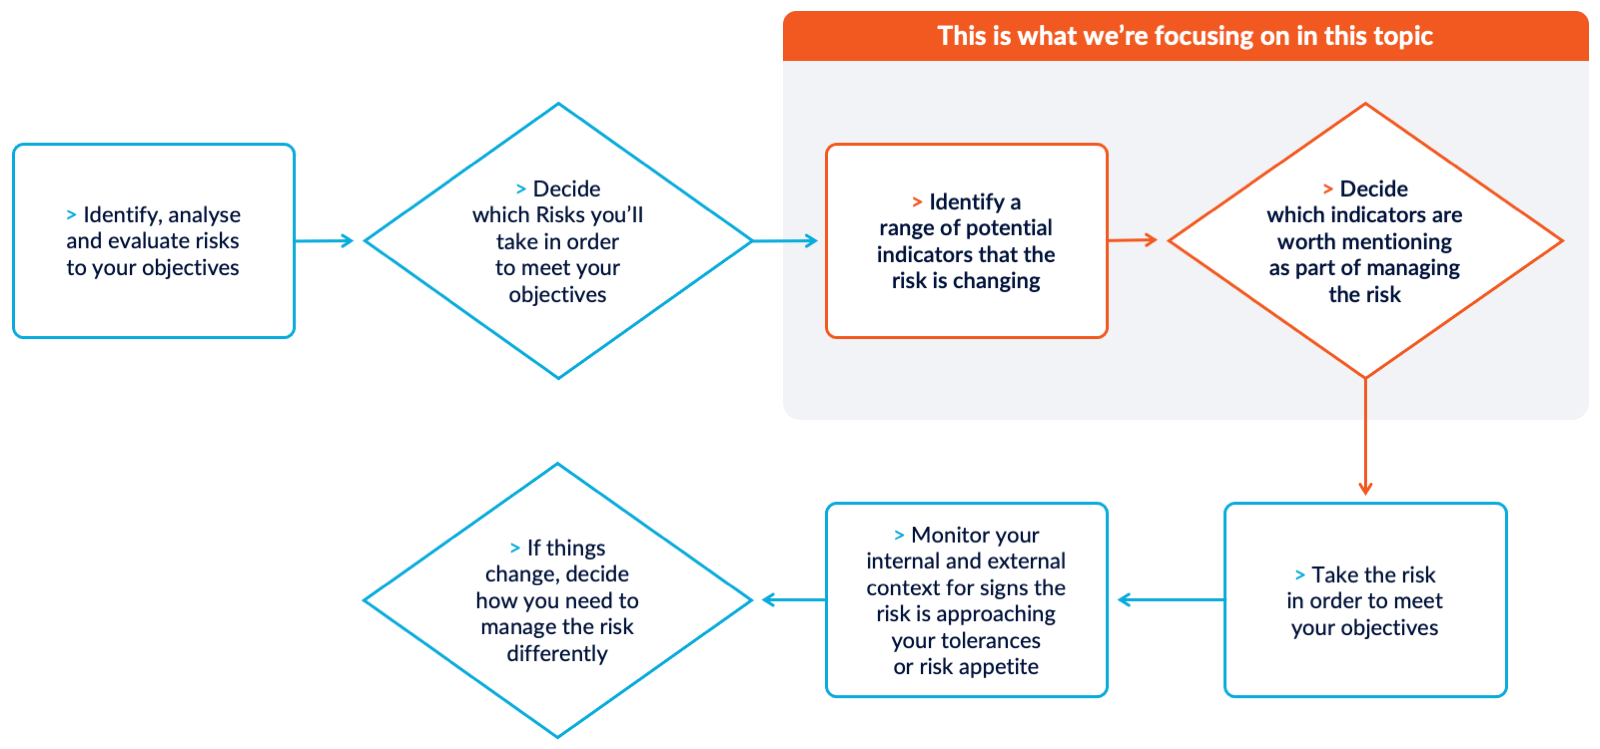
This diagram shows what we’re focused on and where it fits into the overall process of managing risk.
In this topic, we’ll talk mostly about events that you want to avoid—what we normally think of as risk—but remember that uncertainty is also a source of opportunities. Risk indicators can help you here too; for example, you may want to look out for indicators that a region, segment of the population, or a market is ready to adopt a particular service or accept a change, giving you the confidence to pursue an objective that had been too risky up till then.
In this guide, we’ll talk about
- analysing your risk so you can identify the indicators of change
- deciding what indicators are worth monitoring, given the decisions you need to make
- the difference between risk indicators and performance indicators
- creating as well as protecting value
- making decisions.
Identifying potential indicators of change
There are two ways that a risk can change. It can become more or less likely and its consequences can become more or less severe.
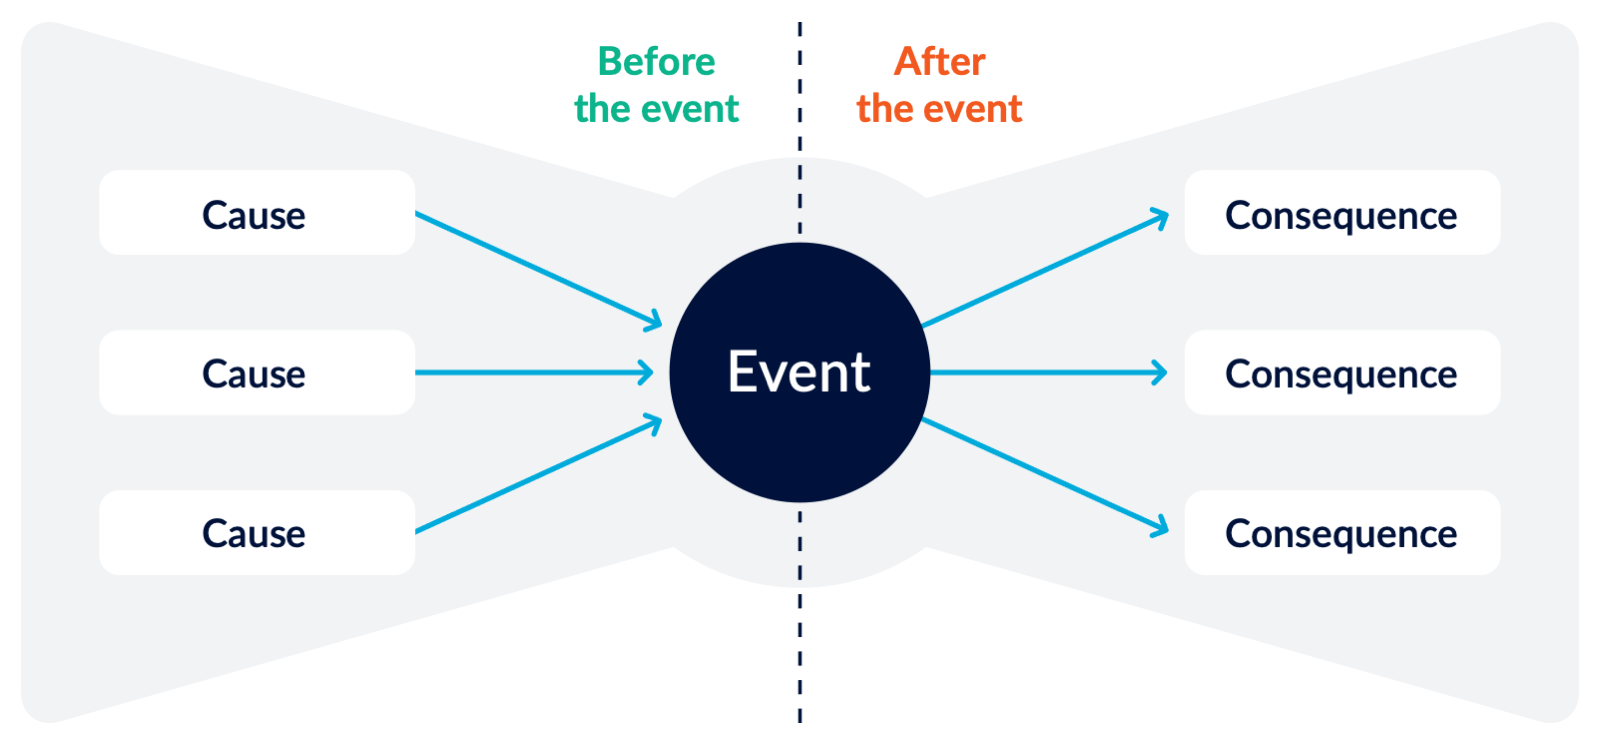
If you want to identify changes in the likelihood of an event occurring, then you need to look at the causes of the event. If you want to identify changes in the severity of the impacts on the people, places and systems in your care, then look at the consequences.
To be a good indicator, they need to
- change in an observable way
- be connected to the causes and consequences that you analysed in your risk assessment.
Use the bow tie to help you identify potential risk indicators and map out what they’re an indicator of.
When do you need to identify potential risk indicators?
The best time to do this is when you’re identifying, analysing and evaluating your risks. This is when you’re building your understanding of the risk and how it affects your objectives.
In fact, it's highly likely that in working on your risk indicators, you'll come to a more thorough understanding of your risk and its causes and consequences, leading you to revise your initial assessment of the risk and its description.
You’ll also have a greater understanding of what’s going on in your internal and external context and how it could affect your objectives.
Workshopping your indicators
A group workshop with the risk owners, control owners and others involved in its management will help you home in quickly on indicators that do actually indicate change. You can do this at the same time as you’re assessing your risks or come back to an assessment you did earlier.
Start with 5 to 10 risks rather than your whole risk register. To produce your shortlist, ask yourself
- Which risks are critical to your objectives?
- Where do you have the greatest risk of loss and harm?
- What kind of decisions do you need to make if the risk changes?
This last point is a subtle one. Risk owners need to be able to draw a direct line between a risk assessment and their decisions about how to manage it. What counts as a reason or information for that decision? How is it grounded in your analysis of the risk? There’s no point tracking ‘data’ for a risk when it’s not going to be used in decisions about that risk.
Deciding what indicators you’ll monitor
The previous step was about identifying reliable indicators of change.
At this point, risk owners and control owners will need to make a judgement call on which risk indicators they’ll monitor. There are three things to bear in mind
- work out the costs and benefits of having the information
- pick a range of indicators
- make effective use of what’s already available.
Work out the costs and benefits
Monitoring risk indicators takes effort, so risk and control owners need to work out whether it’s worth it, given the kind of decisions you need to make.
Ask yourself what are the benefits you’re seeking from having information at your disposal? Will you make better decisions about how you manage risk? Will it improve your accountability? Will it help people collaborate better on shared risk? Are the potential consequences so catastrophic that you simply must be able to track if the event is becoming more likely—bushfire is a good example of this type of event.
What information do you actually need to make a decision about what to do?
Now look at the costs of getting that information. What will it take to
- identify sources of data
- test the quality and relevance of the information
- assess when you’re approaching risk thresholds
- monitor indicators
- analyse
- report to decision-makers.
That’s the cost of monitoring your risk indicators—it’s valuable information about part of being accountable for how you manage risk.
Pick a range of indicators
Once you’ve decided that the benefit of monitoring the risk is worth the costs, you should make sure you watch a range of indicators.
Risk indicators aren’t just about ‘data’ and thresholds—in fact not all risks will have stereotypical ‘data’ or quantitative indicators.
To make your decisions, you need a well-rounded, intuitive grasp of your risk as well as the unambiguous ‘metrics’—if they’re available. You also need a set of indicators that are adequate for your decisions—what do you need to know to make a justified decision and account for it later?
We recommend risk and control owners rely on a variety of indicators in your internal or external context. For example,
- business information systems
- user behaviours in digital environments
- customer surveys
- focus groups
- observational research
- statistical information and analysis produced by governments and other organisations
- whistleblower reports
- the number and types of complaints and incidents
- training histories
- audits
- analysis and evaluation by subject matter experts
- anecdotal reports.
Use the PESTLE and PPRACKIF tools to help you scan the important aspects of your context for indicators of change.
Bear in mind too that indicators don’t determine a decision. Instead, they provide risk and control owners with information. In a positive risk culture, the leadership will make it clear to risk and control owners that this is part of the work of managing risk.
Make effective use of what’s available
Organisational systems generate a lot of data. We encourage control owners to talk to their business and operational specialists about the software and systems used for service delivery, compliance, finances, remuneration and planning to see what information can be extracted for monitoring risk. Again, the PPRACKIF tool can help you examine your whole organisational context.
For information about what’s changing in your external context (use PESTLE) we recommend that you make full use of the information the government sector generates.
A good place to start is DataVic(opens in a new window).
The Commonwealth also has a data portal Data.gov.au(opens in a new window).
For the specific case of climate-change risks, the Victorian government has also published climate change projections(opens in a new window) for the state.
To make effective use of the information, consider these questions
- Does this inform us about the changing likelihood and consequences of the risk?
- Is it relevant to our actual decisions about how to control the risk?
- Are we confident that this information will be consistently reliable over time?
- Could we scale up if we needed to?
The difference between risk indicators and performance indicators
A risk indicator gives you information about a change in your internal or external context.
A performance indicator gives you information about how well you’re doing something.
Bear in mind that the same piece of data can be used for both purposes. Data’s just data. The question is what you’re using it for.
Say, for example, you’re tracking the number and proportion of your workforce that has done safety training by the end of the financial year.
Creating as well as protecting value
Risk indicators can be used to great strategic advantage. We mentioned at the beginning that they could indicate when a region or population segment of a market is ready to adopt a change.
Victoria will have many opportunities over the coming years as we move to net-zero emissions, some of them will involve cultural change in preparation of economic change. The Latrobe Valley Authority is an example of an agency established to create and protect value in a particular region of Victoria exposed to risks as markets and regulatory systems change.
Making decisions
You take and create risk to create and protect value for the people, places and systems in your care.
This means decisions about risk are questions about what we value. Risk indicators tell us when what we value needs to be protected, or there’s an opportunity to create it.
These questions about value are the ones that matter to your responsible body. Risk indicators that help them make decisions about value are the ones that’ll matter to them. Your executive team, with the support of the enterprise manager, can work with your responsible body to identify appropriate indicators.
Risk owners and control owners across the organisation will need risk indicators that help them to achieve the organisation’s objectives and stay within the responsible body’s risk appetite. These are likely to be different from the risk indicators that your responsible body watches. Again, your enterprise risk manager can work with risk and control owners to determine the best indicators for that work.
Risk indicators are vital signs for your organisation, but they don’t automate decision-making. They inform it. Frameworks and processes for risk indicators will help you collect, monitor and report that information.
A positive risk culture is most important of all, though, in that it’ll create the environment in which it’s safe to seek out the information that you need to make decisions.
Updated